Technical analysis is a methodology for forecasting future movements of price based on past information, most notably price and volume.
Price is probably the single most important technical tool. When a stock reaches a new high, or endures a dramatic sell-off, the market is reacting to intelligence in the market. Somebody knows something and is willing to take a transactional risk. The current price is the fair market value of that stock, or market, at that particular period in time. Price Trend is the view of price direction. Is the price moving up, down or sideways. A trend in price simply measures the urgency of the current trades. Are buyers being more aggressive at higher prices, signaling a run higher, or are sellers becoming more aggressive at lower prices, signaling a possible correction. Time is key in evaluating price. You can look at up to the minute real time trends, but one should look at a period of time equal to the desired holding period. If you are looking to hold a security for 6 months, look at the current six month trend. Look at trends in blocks. What looks like an uptrend in the short run, could signal a blip up in an increasingly downward trend over the long term.
Price is probably the single most important technical tool. When a stock reaches a new high, or endures a dramatic sell-off, the market is reacting to intelligence in the market. Somebody knows something and is willing to take a transactional risk. The current price is the fair market value of that stock, or market, at that particular period in time. Price Trend is the view of price direction. Is the price moving up, down or sideways. A trend in price simply measures the urgency of the current trades. Are buyers being more aggressive at higher prices, signaling a run higher, or are sellers becoming more aggressive at lower prices, signaling a possible correction. Time is key in evaluating price. You can look at up to the minute real time trends, but one should look at a period of time equal to the desired holding period. If you are looking to hold a security for 6 months, look at the current six month trend. Look at trends in blocks. What looks like an uptrend in the short run, could signal a blip up in an increasingly downward trend over the long term.
 (click to enlarge)
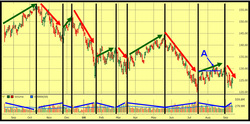
 Volume is how many units are traded in a period of time. For a confirmation of activity, volume is a critical indicator. We would like to see higher volume as prices rise and lower volume as prices fall. Large volume on falling prices would not be a good thing. See the chart to the right for a depiction of price, trend and volume relationship.
Our chart shows five trends higher and five trends lower. In this depiction, as price declines, volume rises and as price rises, volume declines. This is typical of a falling (bear) market and not what an investor/trader would want to see in a rising (bull) market.
At point A, price has risen in the short term to $131.42. The fact that price has risen to $131.42 is the most important, as it helps to define the short-term trend (second most important) which at that moment in time has turned higher, within a longer-term downtrend. The fact that the short-term trend has turned higher is more important than the fact that the move up has been on lower and decreasing volume. Because the move up is on lower and declining volume, you'll want to be cautious. Our Schwab analysts suggest considering using tighter-than-normal stop-loss orders to protect capital and/or profits against the possible resumption of the longer-term downtrend, which in this case is exactly what transpired.
 (click to enlarge)
 We at SSWM believe that everything in nature can be depicted in data and when you map that data, trends and patterns develop. These trends can be plotted in graphs. Pattern recognition attempts to predict the future behavior of market participants by identifying patterns of price, trend and volume.
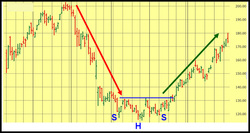
Are buyers or sellers becoming more anxious and impatient to get in or out? Pattern recognition tools include reversal patterns such as double tops and bottoms, head-and-shoulders tops or bottoms, and continuation patterns such as flags, pennants and wedges.
The chart above provides an example of one such trend-reversal pattern, a head-and-shoulders bottom. In this example, this stock trends sharply lower, then changes direction, "reversing" its trend from down to up and then advances sharply higher, which is considered to be a bullish signal.
 (click to enlarge)
 There are two primary trend-following tools:
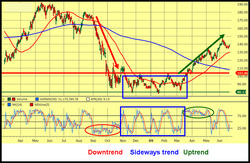
Trading-range - Range-bound markets by definition oscillate, or trade up and down between fairly well-defined lows and highs, known as support and resistance levels. Oscillators are the primary tools for these range-bound markets. Examples of oscillators include stochastics (shown above), the Relative Strength Index and Moving Average Convergence/Divergence (MACD).
Once a range-bound market has been identified, oscillators can help identify possible turning points as the price "bounces off of" the lower end of the range, called a "support" level, or as the price "bounces off of" the higher end of the range, called a "resistance" level.
In the above example, we see examples of trendlines, 50-day (red) and 200-day (blue) moving averages and the stochastic oscillator:
Momentum - How rapidly is the market changing? This is the question that momentum tools seek to answer. Price momentum, or rate of change (ROC), and the oscillators mentioned above, are the primary tools for determining market momentum. The Average Directional Movement Index (ADX) developed by Welles Wilder is another tool that seeks to measure how strongly a market is trending and whether its momentum is increasing or falling.
By recognizing when market momentum has been strong and is beginning to weaken, traders may gain an early warning that the trend may be weakening. We emphasize "may" because the trend does not actually change until it actually does.
Specialty - Consider specialty tools to be those that do not fit into any other category and may provide a different type of insight into the overall technical picture. One notable specialty tool would be "Bollinger Bands®," which may help users identify extreme short-term price moves. Other specialty tools might include Fibonacci percent retracements and Elliott Wave Theory.
Appreciate Charles Schwab working with us, who's working with you? Sua Sponte.
Bradford C. Bruner for Sua Sponte Wealth Management
- A trendline is a sloped line drawn through two or more low points in an uptrend (or high points in a downtrend).
- Moving averages are simply the average closing price of a stock or index for a certain period of time. The more commonly used moving averages are 20-day for the short-term trend, 50-day for the intermediate-term trend and 200-day for the longer term trend. For example, the 20-day moving average is simply the average closing price for the last 20 days. It "moves" through time because at today's close, today's price is added to the average and the price that is now 21 days old is dropped from the average. The slope of a moving average follows behind the trend of price action, confirming the trend and identifying when a trend changes by changing its slope, following the trend in price.
Trading-range - Range-bound markets by definition oscillate, or trade up and down between fairly well-defined lows and highs, known as support and resistance levels. Oscillators are the primary tools for these range-bound markets. Examples of oscillators include stochastics (shown above), the Relative Strength Index and Moving Average Convergence/Divergence (MACD).
Once a range-bound market has been identified, oscillators can help identify possible turning points as the price "bounces off of" the lower end of the range, called a "support" level, or as the price "bounces off of" the higher end of the range, called a "resistance" level.
In the above example, we see examples of trendlines, 50-day (red) and 200-day (blue) moving averages and the stochastic oscillator:
- Notice that the trendlines are somewhat of a "connect the dots" indicator, drawn by literally connecting the lower highs in a downtrend and the higher lows in an uptrend.
- Also see that the moving averages, especially the 200-day, lag behind the trend in price and do not change slope until well after price has changed its trend.
- Finally, notice that in a strong downtrend or uptrend, the stochastic oscillator doesn't oscillate very much.
Momentum - How rapidly is the market changing? This is the question that momentum tools seek to answer. Price momentum, or rate of change (ROC), and the oscillators mentioned above, are the primary tools for determining market momentum. The Average Directional Movement Index (ADX) developed by Welles Wilder is another tool that seeks to measure how strongly a market is trending and whether its momentum is increasing or falling.
By recognizing when market momentum has been strong and is beginning to weaken, traders may gain an early warning that the trend may be weakening. We emphasize "may" because the trend does not actually change until it actually does.
Specialty - Consider specialty tools to be those that do not fit into any other category and may provide a different type of insight into the overall technical picture. One notable specialty tool would be "Bollinger Bands®," which may help users identify extreme short-term price moves. Other specialty tools might include Fibonacci percent retracements and Elliott Wave Theory.
Appreciate Charles Schwab working with us, who's working with you? Sua Sponte.
Bradford C. Bruner for Sua Sponte Wealth Management


